For wealthy investors, grasping the nuances of economic cycles and market fluctuations centers on interpreting the underlying dynamics that influence asset value, rather than merely forecasting market highs. It transforms unpredictability into a clear plan for calculated actions, rather than impulsive reactions.
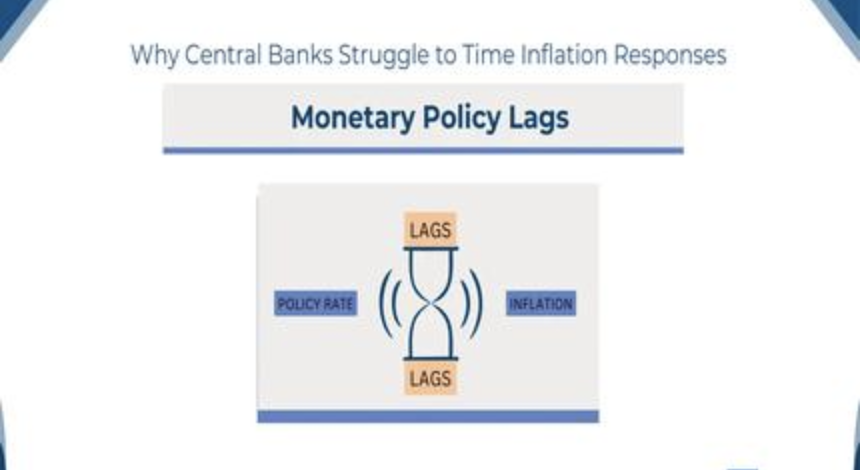
Monitor “Policy Lag” Impacts
Actions taken by central banks, such as interest rate increases or stimulus measures, do not have an immediate effect on the markets. The concept of “policy lag”—the period of 6 to 18 months that occurs between a change in rates and its real impact on the economy—offers potential opportunities. For instance, during the initial stages of a rate reduction cycle, both real estate and growth stocks frequently surge ahead of a complete economic rebound, enabling investors to get ahead of generalized market trends.
Interpret “Sector Rotation” Indicators
Different sectors react to economic cycles in consistent manners. Defensive sectors, such as healthcare and utilities, tend to excel in the latter stages of a cycle when growth begins to decelerate. Conversely, cyclical sectors like construction and consumer discretionary goods perform robustly at the start of recoveries. Being alert to minor shifts—such as industrials outpacing technology—can help identify turning points in the cycle before mainstream economic data validates such transitions.

Identify “Volatility Clusters”
Market fluctuations are not random occurrences; they tend to cluster around significant events. Events like geopolitical conflicts, earnings seasons, or Federal Reserve meetings can trigger spikes in volatility. Wealthy investors can strategically utilize these clusters by acquiring high-quality assets during brief periods of market panic (for instance, due to a geopolitical issue) and reducing stake in overvalued investments when volatility levels are abnormally low, reflecting complacency.
Recognize “Asset Correlation Changes”
The interrelations between different assets can alter during the economic cycle. Typically, stocks and bonds tend to move inversely, yet in times of crisis, their correlation can shift to positive (with both declining together). Additionally, gold, often seen as a safe haven, might not perform well if the dollar strengthens significantly. Monitoring these correlation changes is crucial to prevent excessive risk exposure—such as increasing commodity investments when the correlation between stocks and bonds intensifies.
Utilize “Leading Indicators” Beyond GDP Figures
Gross Domestic Product is a trailing indicator. It’s beneficial to focus on leading indicators, including manufacturing PMIs (Purchasing Managers' Indexes), unemployment claims, or new housing starts. A rising PMI often indicates that the economy is expanding, while a decrease in jobless claims reflects consumer resilience. These indicators empower you to foresee turning points in the cycle before the wider market catches on.
Employ “Volatility as a Valuation Metric”
High levels of volatility frequently lead to asset mispricing. Robust companies with solid financial fundamentals might decline alongside the market during volatile phases, creating potential buying opportunities. Utilize volatility indices, such as the VIX, to assess emotional market conditions—periods of extreme fear (indicated by a high VIX) usually present more favorable entry points than times of extreme confidence (reflected by a low VIX) for long-term investors.
Recognizing patterns in economic cycles and market volatility relies on awareness and analysis rather than fortune-telling. For affluent investors, this approach involves leveraging discreet indicators to strategically position investments—purchasing during others' moments of fear and reducing holdings during times of euphoria—transforming market fluctuations into opportunities for wealth accumulation.

Before Passive Income, Boost Active Income First
The Pros and Cons of Peer-to-Peer Lending
How to Reducing Taxes through Tax-Efficient Investing
Can you make tens of thousands of dollars a year with a few hundred thousand dollars of capital? Are
Stock Investing Pitfalls: New HNWIs’ Costly Mistakes

Why Some Feel Anxious After Financial Freedom
A 10-Year Finance Journey of an Office Worker