The Manager’s Shadow Portfolio
Look beyond stated holdings—examine a fund’s "shadow portfolio." This refers to the positions a manager takes but keeps under the 1% disclosure threshold, often revealing their true convictions. Tools like advanced analytics platforms can aggregate these micro-positions, showing whether a fund claiming to focus on tech is quietly accumulating healthcare startups. For high earners, this uncovers alignment: a manager with hidden stakes in luxury real estate REITs might better suit your portfolio than one with surface-level consistency but conflicting undercurrents.
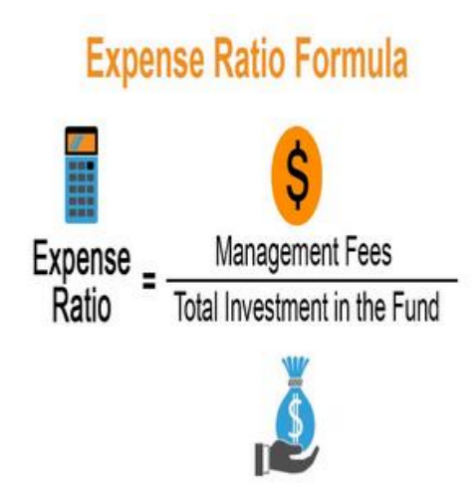
Expense Ratio Nuances
The headline expense ratio is misleading. Dig into "acquired fund fees"—costs from underlying ETFs or mutual funds within the fund itself. A seemingly low 0.7% ratio could balloon to 1.5% when these hidden charges are included. Also, check "soft dollar arrangements," where fund companies use trading commissions to pay for research. Excessive use signals prioritizing perks over performance, a red flag for long-term investors seeking transparency.
Volatility’s Hidden Twin: Drawdown Depth
Standard deviation measures swings, but "maximum drawdown" reveals true risk. It tracks the worst peak-to-trough decline—critical for high earners who can’t afford prolonged recovery periods. A fund with 15% annual volatility might seem manageable, but a 40% maximum drawdown (common in aggressive growth funds) means a \(1M investment could shrink to \)600k, requiring a 67% gain just to recover. Compare this to a similar-return fund with a 25% drawdown; the latter preserves capital better during downturns.
Cash Drag Efficiency
A fund’s cash position tells a story. Too much (over 10%) signals a manager nervous about market conditions, potentially dragging returns. Too little (under 2%) leaves no buffer for opportunistic buys during dips. Elite funds maintain a "dynamic cash band"—3-7%—adjusting based on volatility signals. For example, a tech fund that raised cash to 6% before the 2022 selloff showed discipline, while one staying fully invested revealed overconfidence.
Holder Concentration Signals
Institutional ownership matters, but look deeper at "insider ownership"—how much the fund’s management team has invested personally. A manager with 20% of their net worth in the fund is incentivized differently than one with token holdings. Also, check "redemption frequency": funds with high institutional turnover (over 50% quarterly) face forced selling risks, while those with stable, long-term holders (like endowments) enjoy more strategic flexibility.
Risk-Adjusted Returns Beyond Sharpe
The Sharpe ratio is basic—use the "Sortino ratio" instead. It only penalizes downside volatility, ignoring upward swings. A fund with a Sharpe ratio of 1.2 might look strong, but a Sortino ratio of 1.8 (vs. a peer’s 1.0) indicates it protects against losses better—vital for preserving wealth. For sector-specific funds, add the "information ratio," which measures excess returns against a relevant benchmark, weeding out those that just ride market waves.
These metrics reveal a fund’s true character—beyond the glossy prospectus. For high earners, it’s not about picking winners, but avoiding hidden risks that erode returns over decades. By focusing on these under-the-radar indicators, you turn fund analysis from a numbers game into a strategic assessment of alignment with your financial goals. After all, the best funds aren’t just profitable—they’re predictable in their reliability.

Financial Harmony: Institutionalizing Family Finances
Types of Mutual Funds
Why Systemic Risk Is Inevitable: Tech’s Role
5 Common Financial Mistakes Gen Z Should Avoid in Their 20s
Wealth Safety in Uncertain Times: Strategic Guardrails
Investment 101: Stocks, Funds, Bonds
The Ethical Framework for Investing: Juggling Profit and Values